Infographics alongside mapping, routing, demographics analysis make for real intuitive insights.
Compass Analytics is a Cloud platform that uses a ‘best of breed’ combination of Microsoft Azure and Esri ArcGIS technologies, plus Compass Informatics expertise, to deliver a decision support tool with strong spatial and network analytical capabilities.
Our solution can deliver demographic analyses across a range of variables, produce isochrone maps for drive time, walk time and buffer distance, export maps and reports and share user-configured map views with others.
Compass Analytics is deliberately architected to incorporate an organisation’s own spatial and tabular data and integrate with their existing Esri GIS licensing.
Through our product development plan, we continue to tap into Esri services, in particular those for transportation.
Features & Functions
Compass Analytics has a strong suite of ‘out of the box’ mapping and planning functionality. The platform also has a well-planned development roadmap, with functionality that can be delivered over the short, medium and longer-term.
Demographic and Accessibility Analysis
Compass Analytics can generate instant demographic and accessibility analysis. The user can choose a point location, select a mode of transport and time or distance variables e.g. drive time, walking time, or buffer distance, and run demographic analysis. The user can export this analysis as Excel or pdf reports.
Upon integration of the Esri Transportation Routing and Network Analysis services, this demographic and accessibility analysis runs against a route as well as a point feature.
Compass Analytics can also create ‘Community Infographics’. By selecting a region boundary, the user can quickly view infographic-type images summarising the demographic makeup of that area.
Compass Analytics is currently set up to use Esri demographic data and can take in other national or regional data.
Routing, alongside isochrone travel time analysis, combines ease of use with richness.
Incorporate Additional Data Sources to Refine Analysis
With our Compass Analytics solution, we can incorporate additional data that will further refine demographic and accessibility analysis. We work with partner planning and consulting engineers to ensure all data is fit for purpose, sensible, and will contribute value to end user understanding of the analyses.
Isochrone visualisations
Compass Analytics can generate isochrone visualisations. The user can choose a point location or route, select a mode of transport, time or distance variables (e.g. drive time, walking time, or buffer distance), and run demographic analysis. The user can export this analysis as Excel or pdf reports.
Map Sharing
In Compass Analytics, users can work within the mapping interface, turning on and off different layers, creating routes and preparing analyses, then click ‘Share’ button to share the specific view with others.
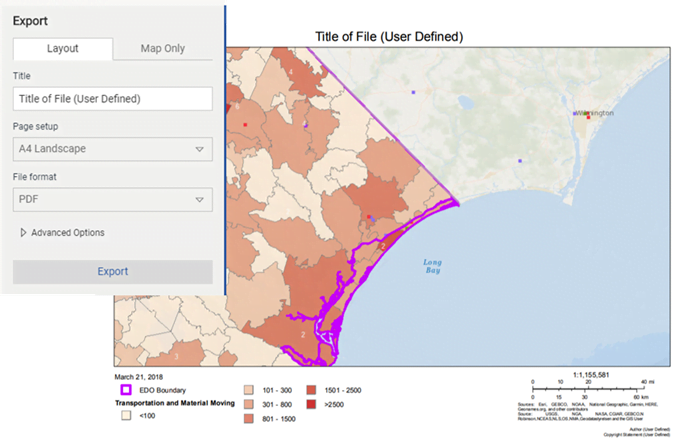
Flexible print and view sharing aids collaboration.
Users can export configurable map views using the print widget. Users can select a map layout to export a map image from – with an editable title, map author and copyright statement. The legend of any active layers is included in the layout, as well as a scale bar and the export date. Users can also opt for a map only export. In this case, only the map image is exported. This is especially useful for including images in reports.
Images can portrait or landscape in orientation. Images can be exported as all major image types, including JPG, PNG, PDF, GIF etc.
Flexible and intuitive map layer list and controls.
The Layer List
The Compass Analytics LayerList is an intuitive and hierarchical layer list that can be configured to include any GIS data service.
With the Compass Analytics LayerList, users can:
Search for layers, using a free text layer search box.
Easily view and manage active (turned on) layers in the ‘Active’ tab.
View map symbology in the dedicated ‘Legend’ tab.
In addition, a range of standard widgets are available for inclusion via configuration updates. Custom widgets can be added.
The LayerList can be configured for different audiences,
Base Maps and Background Maps
Compass Analytics comes with a suite of base maps and satellite imagery. Basemaps available include:
Open Street Maps (OSM)
Esri base maps and satellite imagery, including a light grey canvas, which is especially useful for presenting user customised graphics and details.
A range of default as well as custom user actions can be configured per layer
Software as a Service (Saas) Cloud platform, or internally hosted
Compass Analytics is offered as a ‘Software as a Service’ (SaaS), hosted by Compass Informatics, on the Microsoft Azure cloud platform. Data is stored in an Azure SQL database which can be used to store key datasets for searching and filtering. Data is encrypted at rest and when in transit, with all communications over TLS. We can also config and host on internal infrastructure in your organisation.
Compass Analytics utilises the benefits of MS Azure such as web jobs, queues, scheduled tasks, table storage, geo-replication, auditing and threat detection. Application insights and monitoring are also employed to ensure that a robust, reliable, secure, performant, cost-effective and flexible solution is delivered.
The Compass Analytics mapping interface is developed using Esri ArcGIS API for JavaScript 4.x series. This is Esri’s next-generation mapping interface with Esri being the leading global supplier in GIS software.
As a multi-tenanted application, the client can have multiple themes that are configured specifically for different audiences or end-users. Different themes can contain data and functionality that is appropriate to a target audience.
The Compass Analytics platform is an innovative and emerging technology. The platform was developed by Compass Informatics originally as a decision support tool for large US companies locating or relocating premises. Compass Analytics offers decision-makers strong search functionality, a suite of demographic analyses to support design making and excellent opportunities for integration with the client’s own GIS data.
Compass Analytics has the following advantages:
It is a strong cloud-hosted platform, built with Microsoft Azure (including Microsoft SQL) and Esri GIS technologies.
It has the capability to integrate data, both spatial and non-spatial, from master data sources, and local data sources.
It can act as a centralised hub for the integration of forecasting, planning and assessment tools and data.
It can present the same data in different ways to your various audiences.
Help & Support
Compass Informatics operates a dedicated help desk. Support calls can be taken via Twitter, Facebook, SMS, email, phone. Service Level Agreements can be put in place.